This week our presented task is located in Ireland. At the campus of the Dublin City University (DCU) our MoMaTrE partner Christian Mercat created the task “The weight of DCU” and gave us an interview about this task and the value of using the MathCityMap app.

What´s the topic of the task?

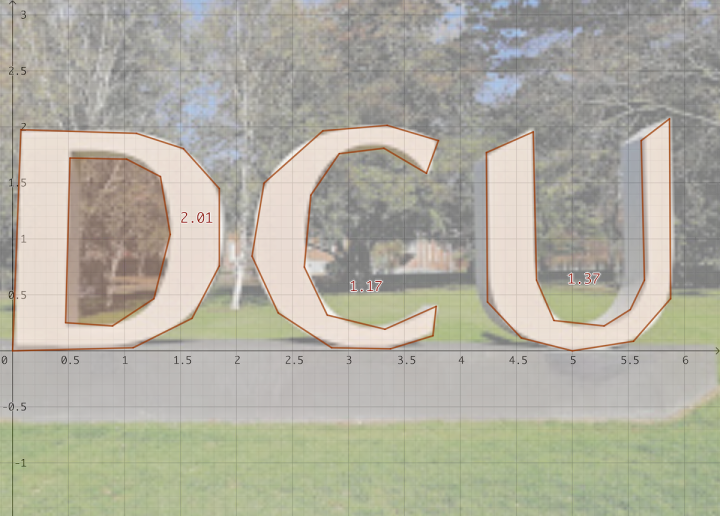
On the campus you can find a huge DCU solid rock sign. I really wondered how much that could weight! So I investigated and figured out that one could estimate the surface of the letters and the depth of the sculpture.

How could you solve this problem?

You have to estimate the average width of the letters and their lengths. For example, C is a 2/3 portion of a circle of diameter 2 m and average with 30 cm. So is has a surface of 1.2 m². The modelling of D and U happens equally. Totally the sculpture has a surface of 4.5 m². The depth of the stone is 50 cm, which leads to a total volume of 2.25 m³. The density of the stone being 2.4 (that’s given in the first hint), the total weight of the sculpture is around 5400 kg. The estimation of the surface being tricky, I actually checked again by taking a picture from a distance and estimating numerically the total surface with the help of my computer. 

Estimation of the sculptures` surface.

What´s the didactic aim of the task?

Clearly, I want here to get first the students to have a rough estimation of the degree of magnitude, is it around hundreds of kg, a few tons or tens of tons. I give a broad « orange » zone between 3000 and 7500 kg for those trying to figure out by simply bracing their arms around the sculpture to get a sense of the volume, which I find fair enough for an answer. But then, trying to model each letter as simpler geometric shapes is really the main focus of this task. It can not be done exactly, the average width of each letter is a matter of debate, which is good. The « green » zone might be a little bit too tight (between 5000 and 6000) which is only a 20% width around the expert estimation, but the depth is without any doubt 1/2 meter so the uncertainty really is on the surface estimation.

Why do you use MathCityMap?

I love taking the pretext of a MathCityMap trail in order to stroll around on a campus or in a park, appreciating the scenery from this very specific perspective of looking around for objects that tickle my mathematical inclination, keeping open the scientific eye in me.

Today´s task of the week is located in Lüneburg, Germany, where the teacher trainee Jennifer Oppermann created the task “The green ear”. She gave us an interview about this task, mathematic modelling and the MathCityMap project.

What´s the topic of the task?

The question is, how tall the human being would be, the green ear belongs to. To solve the task students first have to measure the sculpture of the green ear, followed by measuring an ear of a student. In addition, the body size of this students should be identified.

Afterwards the quotient of the length of the green ear and the students´ ear is multiplicated with the body height of the student. Thereby the size of the human being, to whom the green ear would belong, can be estimated.

What´s the didactic aim of the task?

While working on the task, students should improve their competences in mathematic modelling. Modelling means to link the reality and the mathematic and to solve a given problem through a mathematic calculation. Thus, MathCityMap is a helpful tool to observe the connection between environment and mathematics and to exert mathematical strategies.

How do you use MathCityMap?

To discover our near environment out of a mathematical perspective, we created a math trail through the Hanseatic town of Lüneburg. The MathCityMap project enables mathematic interested people to solve our tasks around Lüneburg and to increase their mathematical competences.

Creating a MathCityMap task is too difficult and time-consuming? In this article we´ll introduce you to our tool “task-wizard”, which enables you to create tasks with a few clicks. In the following we´ll explain, how to use the “task-wizard”.

In all cities exist similar objects, which provide many possibilities for outdoor mathematics. For those objects, e.g. the gradient of a ramp or the mass of a cuboid stone, we prepared standardized templates in our web portal. Altogether, we arranged twenty variegated templates for the themes combinatorics, algebra (functions) and geometry.

To create a new task with our wizard, you only have to choose one of the given templates and put in a picture of the object and your measured values. As the wizard generates the sample solution and the hints (partly with pictures) automatically, the tool allows you to create a task with only a few clicks.

Step-by-step instruction:

  1. Open the option „New task” in the MathCityMap portal
  2. Click on the option „Wizard“.
  3. Choose your favoured „Wizard-task” (e.g. velocity – escalator – velocity in m/s) and fill in your measured values.
  4. Upload a picture for your task and define the geolocation, Done!

Have fun!

The task of the week is back! Today we present you a task, which was developed during a teacher training at the Georg-Büchner-Gymnasium in Bad Vilbel near Frankfurt.

Next to the schoolyard we found this interesting sculpture of a water bottle. Immediately we wanted to ascertain, how many litres of water the bottle would contain. For the task “Volume of the bottle” we assume that the artwork has a wall thickness of 3 cm.

How the volume of the bottle can be ascertained?

For the modelling we divide the artwork in a frustum of a cone and a circular cylinder. We look on the object as compounded solid.

What´s the aim of the task?

The complexity of the task is to find a useful mathematic model for the object, which is a fitting transfer of the reality and is calculable with a manageable time exposure all at once. To solve the problem, you have to find a compromise between mathematical precision and practicability. Hence the task is a good example for a lot of modelling problems.

MathCityMap was honoured by the German competition “Land of Ideas”! The projects of the ten award winners are currently presented in a branch of the Deutsche Bank in Wiesbaden.

Next to the exhibition we created two math trails in Wiesbaden. The trail “Land der Ideen WI-kurz” is recommended for students from the sixth grade. To solve the tasks you have to discover the environment around the Marktkirche of Wiesbaden through accurate observing, measuring and counting. For users from the ninth grade we prepared the trail “Land der Ideen WI-lang”.

Check out our new MathCityMap trails in Wiesbaden. Have fun!

More posts about the “Land of Ideas” award:
MathCityMap is one of the Landmarks 2019
“Land of Ideas“ Team visits MathCityMap